
As part of developing the Echelon Reference Series, I make heavy use of GraphViz. GraphViz includes several layout engines, but the key one here is called ‘DOT’.
DOT takes a file with a simple declarative syntax of nodes and edges, and lays them out as a graph. You can specify node positions explicitly, or add hints to help guide it… but overall, it’s usually easiest and best to let DOT figure it out.
Of key importance here, DOT tends to lay graphs out in something close to a matrix. Each rank gets put in a column, that’s easy to see. The nodes almost but not quite line up in rows, though.
With a couple little tricks, though, it can get really close. Some might say it’s still not strictly a matrix, doesn’t quite fit a Cartesian grid… but it’s close enough I can work with it.
Example DOT Diagram: Angelic Blood
The diagram for the Angelic Blood feat is a great example of what I see.
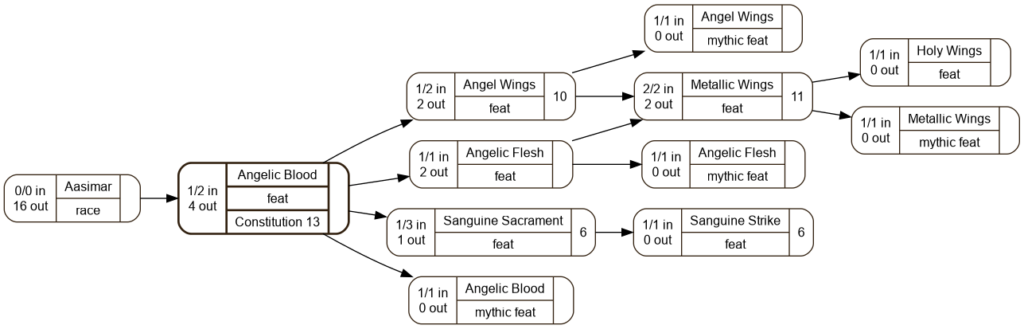
Columns are obviously easy to see. The nodes in the first two columns align in a single row. The nodes in the third and fourth columns align in the same rows. Well, three rows, but the other two nodes are evenly spaced with those. The last column doesn’t line up with the two to its left.
However, if you look closely…
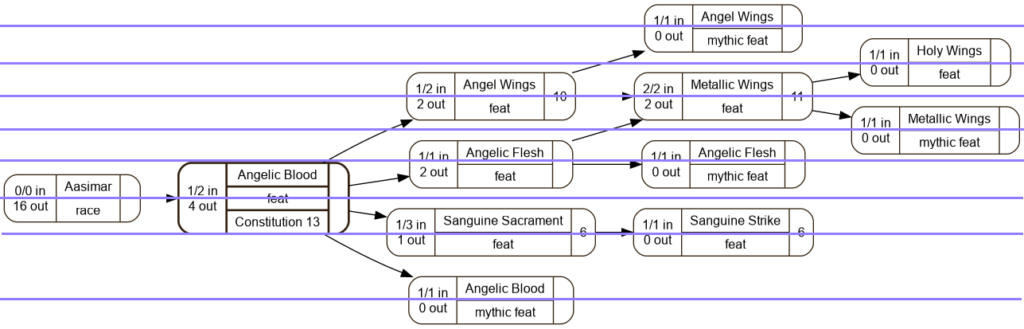
Within the limits of my ability to draw evenly-spaced lines… the nodes all line up on half-row boundaries. The Angelic Blood mystic feat at the bottom is ‘two rows’ away from the others, in spacing.
I can work with this.