The post title is a bit of a stretch, but that happens during the A-Z Blog Challenge.
My recent realizations showed me I’ve got some work to do. Among other things, I see:
- Add a second ‘DOT’ output stream, containing the minimalist nodes I need to find node positions.
- Actually calculate those positions and store in an intermediate file, by system and domain.
- Integrate layouts into my output.
- Create means to add interventions. These will be mostly node tweaks, but I expect to want to fully replace or override diagrams. [secondary; first cut I’m happy just to see the diagrams in place!]
- Integrate individual files into other outputs (probably PNG into Word, SVG into HTML). [low priority, since those output paths aren’t even implemented yet]
I see the following changes in my workflow.
- LinkGraph to Package, to identify which objects have prerequisite diagrams.
- DOT to JSON (new), with the layout details produced by DOT.
- DOT to SDOT (remove, I don’t use it).
- JSON to Position (new), parsing the JSON files and aggregating to an XML file containing the converted diagram details.
- Position to PubTeX (new), incorporating the diagrams and laying them out using TikZ.
I’m not totally certain where the interventions will go. I see two files I will need.
- Node intervention (step ‘Node’, perhaps). These contain the little tweaks that apply to the nodes, and will apply across all domains in a system. That is, it will have similar scope as the taxonomy files. I think this will be an Excel workbook where each non-header row will contain ID fields and the override instructions.
- Diagram intervention, which will apply to a single domain in a system (diagrams can differ between domains). I’m leaning toward Word files that are processed the way others are, and folded into the Master aggregate. I see a
TableEgdDiagramstyle that will work for the table markup. I may also want a newd20#Diagramobject style so the object will be treated as a full object.- Because the diagrams can differ between domains, I expect to have multiple per ID, and select by domain when rendering.
- I have a similar behavior with Supplement objects. Make sure they both work the same way, on this point.
Yet again, the workflow diagram changes.
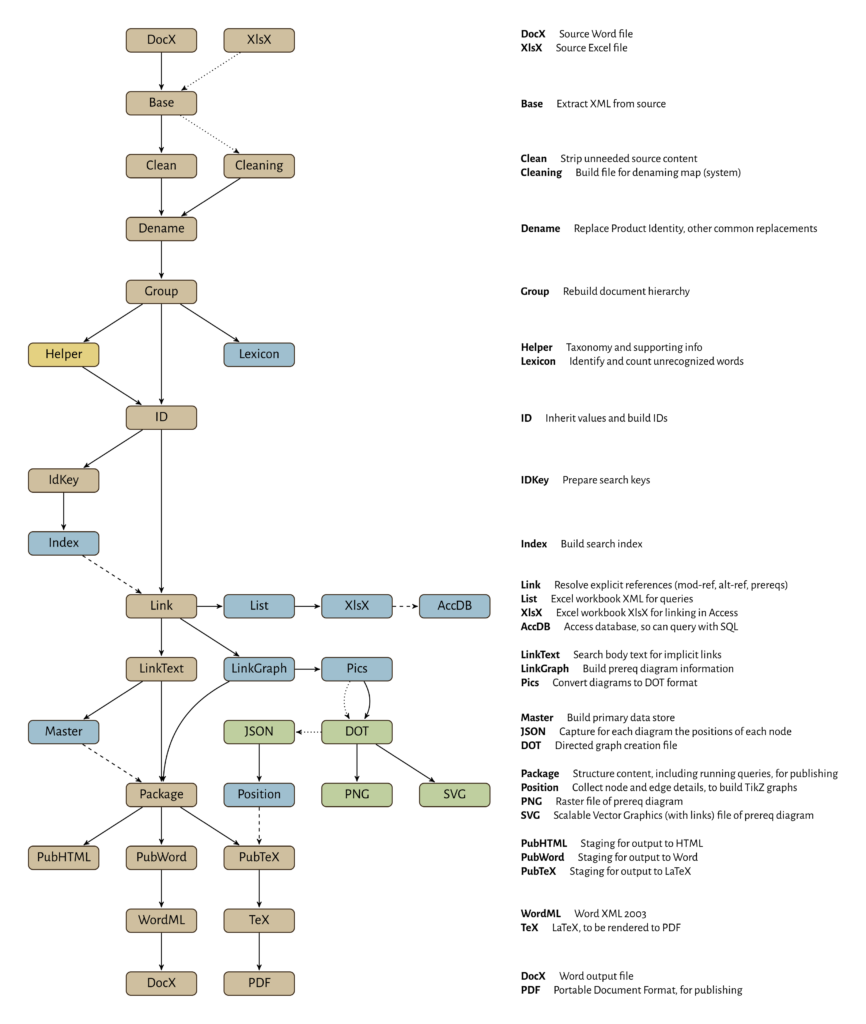
As much as I love working with DOT and what it does, I admit it doesn’t handle some things well. DOT works best when you let it decide how to lay things out. You can hint, but short of setting actual (x, y) values you don’t have full control. My workflow diagram is getting complex enough that I couldn’t hint hard enough to get the layout I wanted.
So, I ended up redrawing… with TikZ. I used a matrix, as a matter of fact, and I do like how it looks.
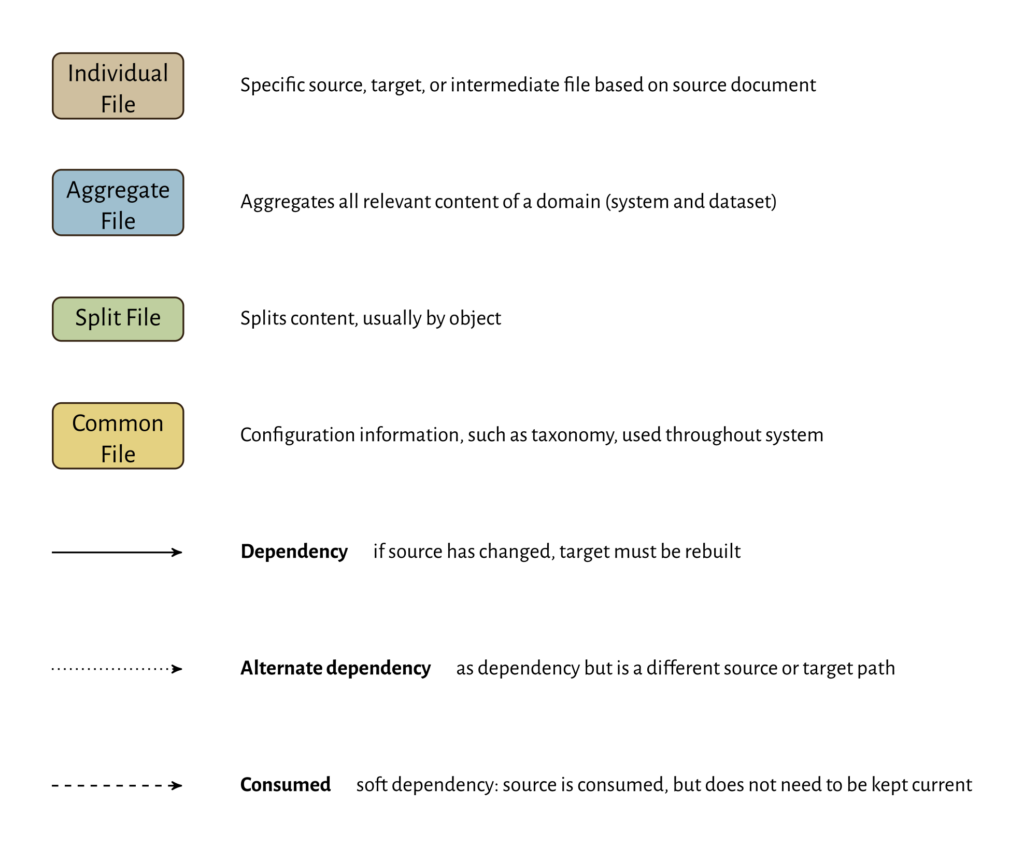
I also redrew the legend, and added the edge types to it.