
In my latest post I said “I can automate this”.
There were two last pieces I needed before I can automate diagram conversion.
- Matrices with ‘half rows’, a way for nodes to span what are otherwise two adjacent rows.
- A way to decide when this is needed.
It turns out these both are solved more easily than I expected.
Spanning Matrix Rows
The normal layout behavior of a matrix node in TikZ is pretty straightforward.
- Examine the content of each cell in a row, set row height to the largest height.
- Examine the content of each cell in a column, set cell width to the largest width.
- Lay out Cartesian grid, respecting also the ‘row sep’ and ‘col sep’ settings.
Almost always, this is what you want when using a matrix.
… my first draft of this post was going to explain the things I tried. Eh, no sense being silly, I showed I know how to solve this.
TikZ ‘row sep’ Setting
Turns out this is much simpler than I expected. Normally row sep says how far to separate the rows. That is, how much space to put between the rows’ content. I found there is another option, between origins, that says how far apart to make the row midlines… regardless of content size.
Bingo. If I set rows 20mm apart I get a neatly-arranged Cartesian grid. If from time to time I have a pair of 10mm separations I have a ‘half-row’ between the regular rows.
Yes, yes it does work as expected.
Except this was done by hand, I need to automate this decision.
Finding Spanning Cells
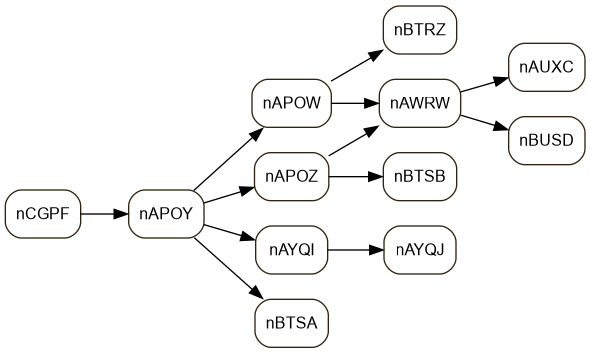
Finding columns in DOT output is very easy. All I have to do is extract the rectangular node graphics from the output image and find their midpoints. Everything with the same midpoint X value (give or take, there can be rounding differences) is in the same column. Easy!
Also, kidding. With only a little planning (and edges and text with non-black color) I actually could do it that way. Much easier to have DOT output a JSON file with the drawing instructions and parse that.
Each node has a pos with [X, Y] values. Read those and I’ve got the midpoints of the nodes. From there, it is easy to find the columns and rows. It turns out the [X, Y] values do make a sparse matrix… but I still need to see where I’ve got overlaps.
I tried a few things, before finding the one that worked.
- Look for size of gap between ‘rows’. If the row Y-values are this far apart, they’re full rows, and if they’re that far apart they’re half rows. Failed miserably because the node heights can have varying effect, and even with rounding there were too many false determinations.
- Examine min-Y and max-Y of each row. If it overlaps the vertical range of the adjacent row then it’s a half row. Failed again because some nodes are just really tall, and that made me more miserable.
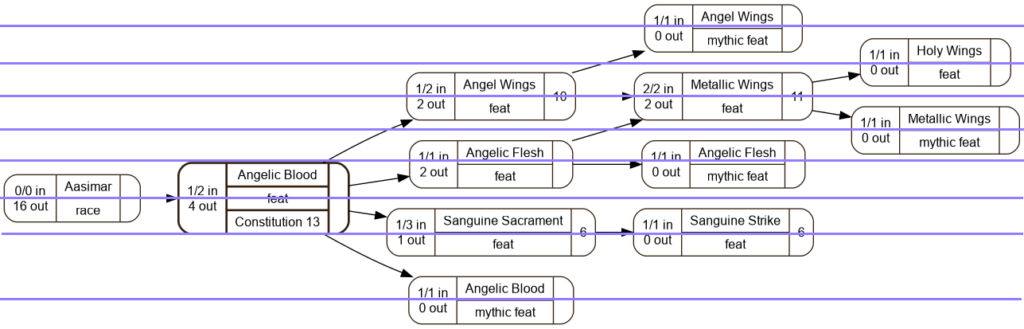
- … but it gave me the seeds of my success. If I make the nodes all the same height by giving them consistently-sized labels, the overlaps should be true.
I gave it a try…
… and yes, it does indeed work. Adjacent full-size rows do not overlap, adjacent half-rows do overlap. Each label maps back to an internal ID of an object in my data set. I can get from here back to the original game object.
Closing Comments
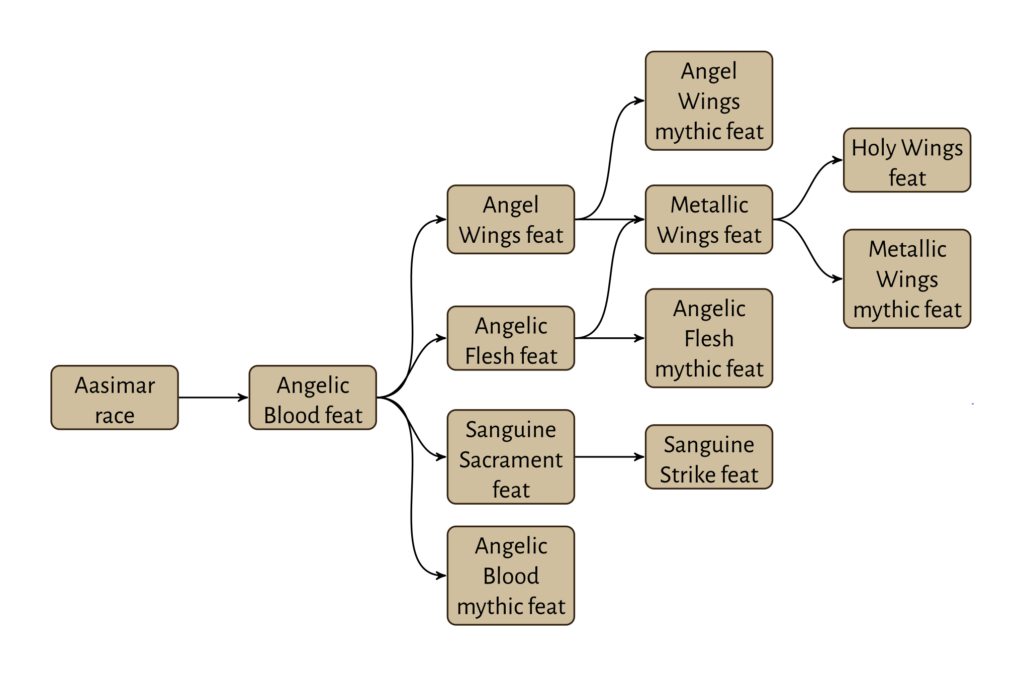
I now have all the pieces I need to convert prerequisite graphs in DOT to TikZ diagrams. Some will undoubtedly need manual intervention, mostly to make better use of space… but a very large percentage should be totally automatable.
It was this realization that caused me to conclude I’m changing direction in this year’s A-Z Blog Challenge. I’ve wanted this facility for almost a decade, I’m working on this now.