 A conversation on Facebook today prompted this article.
And this article ended up rather longer than I expected. I was hoping to get to sleep early tonight. Ah well.
Many — perhaps most — roleplaying games involve a lot of information. On the ‘mechanical’ side you might have monsters, spells, feats, skills, and many other things, and on the ‘story’ side you might have PCs, NPCs, locations, special items, various social constructs (nations, tribes, guilds), and many other things. Both the mechanical and the story side can have complex relationships between their components. Classes and feats may have (and may be) prerequisites, as may a certain number of ranks of a skill, ability to cast certain spells, and so on. NPCs often have relationships to other NPCs (and PCs, and places, and special items, and so on).
Complex relationships like these can be not only complicated, but confusing. If they are tracked in lists (or worse, paragraph) form they can be difficult to follow and understand. If they aren’t even in the same place (as is common with roleplaying game objects) it can become very difficult indeed.
… I feel like I’ve written about this before, and not that long ago. I’m guessing somewhere around April E, 2014… close enough, D! D&D: Data and Diagrams. Okay, look there for the background I was going to write here about why you want to visualize things, to render the relationships graphically, but that’s already done.
So, on to the actual topic, how I go about it.
Graphviz
… I’m kind of tempted to stop right here. Go to http://www.graphviz.org/ to find one of the single best tools I’ve ever found for data analysis.
Not so helpful, perhaps, so I’ll expand on it a bit.
Graphviz is a package originally created by and released as Open Source by AT&T. Graphviz stands for “Graph Visualization” and provides several tools that can be used to lay out graphs using different algorithms. In all cases the programs take simple text files as input and can produce output in PNG, SVG, and a few other formats.
Below I describe two of the layout programs in Graphviz. There are others, but these are the two I use most often.
dot
dot is one of the first ones many people use. Given a set of nodes and relationships it lays them out as a digraph (directed graph) in a hierarchical manner (from ‘top to bottom’ or ‘left to right’ most often).
In the node-based megadungeon series I used dot for all the diagrams.
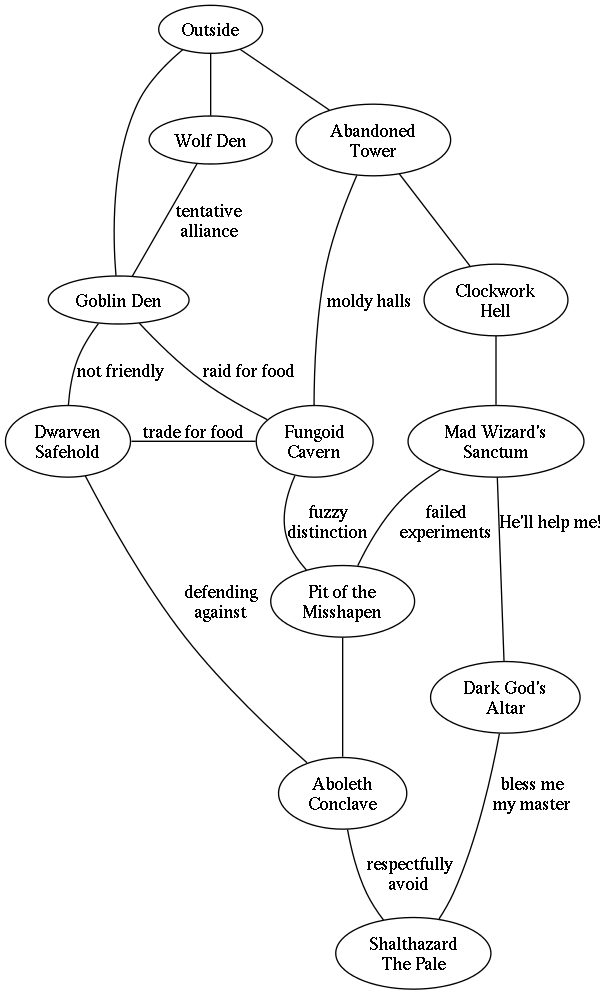
This graph was rendered using the default settings (elliptical nodes, no fill, black text, and so on). However, by using ‘graph’ instead of ‘digraph’ as the first line it renders the image as a graph, all the edges are undirected (no arrows).
1 2 3 4 5 6 7 8 9 10 11 12 13 14 15 16 17 18 19 20 21 22 23 24 25 26 27 28 29 30 31 32 33 34 35 36 37 38 39 40 41 42 43 | graph "G" { overlap=false; outside [label="Outside"]; goblin [label="Goblin Den"]; fungoid [label="Fungoid\nCavern"]; aboleth [label="Aboleth\nConclave"]; wolf [label="Wolf Den"]; wizard [label="Aristothanes'\nSanctum"]; fane [label="Dark God's\nAltar"]; misshapen [label="Pit of the\nMisshapen"]; clockwork [label="Clockwork\nHell"]; tower [label="Abandoned\nTower"]; dwarf [label="Dwarven\nSafehold"]; dragon [label="Shalthazard\nThe Pale"]; outside -- wolf; outside -- tower; wolf -- tower; outside -- goblin; wolf -- goblin [label="tentative\nalliance"]; goblin -- dwarf [label="not friendly"]; goblin -- fungoid [label="raid for food"]; dwarf -- fungoid [label="trade for food"]; tower -- fungoid [label="moldy halls"]; tower -- clockwork; clockwork -- fungoid [label="maintenance\ntunnel"]; clockwork -- fungoid [label="organic\ndisposal"]; fungoid -- misshapen [label="fuzzy\ndistinction"]; clockwork -- wizard; wizard -- misshapen [label="failed\nexperiments"]; wizard -- fane [label="He'll help me!"]; misshapen -- aboleth; dwarf -- aboleth [label="defending\nagainst"]; fane -- dragon [label="bless me\nmy master"]; aboleth -- dragon [label="respectfully\navoid"]; fane -- aboleth; clockwork -- aboleth; misshapen -- fane; {rank=same; dwarf fungoid wizard} {rank=same; misshapen fane} } |
The “overlap=false;” on line 2 causes the nodes to be spaced a little differently, to minimize the overlap between them. They still can overlap if the layout algorithm can’t find a more pleasing (for a programmatically-determined value of ‘pleasing’) layout.
The next twelve non-blank lines (lines 4-15) define nodes in the graph using some simple names, and assign a ‘label’ attribute to each that gives each a more descriptive and meaningful name for readers.
The next 23 non-blank lines (lines 17-39) define the edges between the nodes. Because this is a hierarchical graph the edges are treated as ‘first identified is the parent’, in the case the graph is cyclic, as this one is. Using ‘–‘ (two hyphens) indicates an undirected edge, while ‘->’ would indicate a directed edge (which you don’t have in an undirected graph like this, but can fake… out of scope for this discussion). Some of these edges have a label attribute assigned that hints at the nature of the relationship between the nodes. For instance, the edge between ‘fane’ and ‘dragon’ (line 35) has “bless me\nmy master” — the dragon is evidently a disciple of the god of the fane. The ‘\n’ in the middle of the string is a newline and causes there to be a line break between ‘me’ and ‘my’.
Finally, the two lines at the bottom starting with ‘{rank=same;’ (lines 41 and 42) are an instruction to dot to put the identified nodes in the same rank. I wanted to display them at the same rank to indicate that they are approximately the same depth/distance from the surface.
Pass this script to dot and out comes the PNG displayed above.
Similarly, I use dot extensively while working on the Echelon Reference Series. Where the graph above was designed by hand, in that I identified the nodes and edges by hand, and their attributes, the source files for my working images are generated programmatically from my source files.
The source for this one is somewhat more complex.
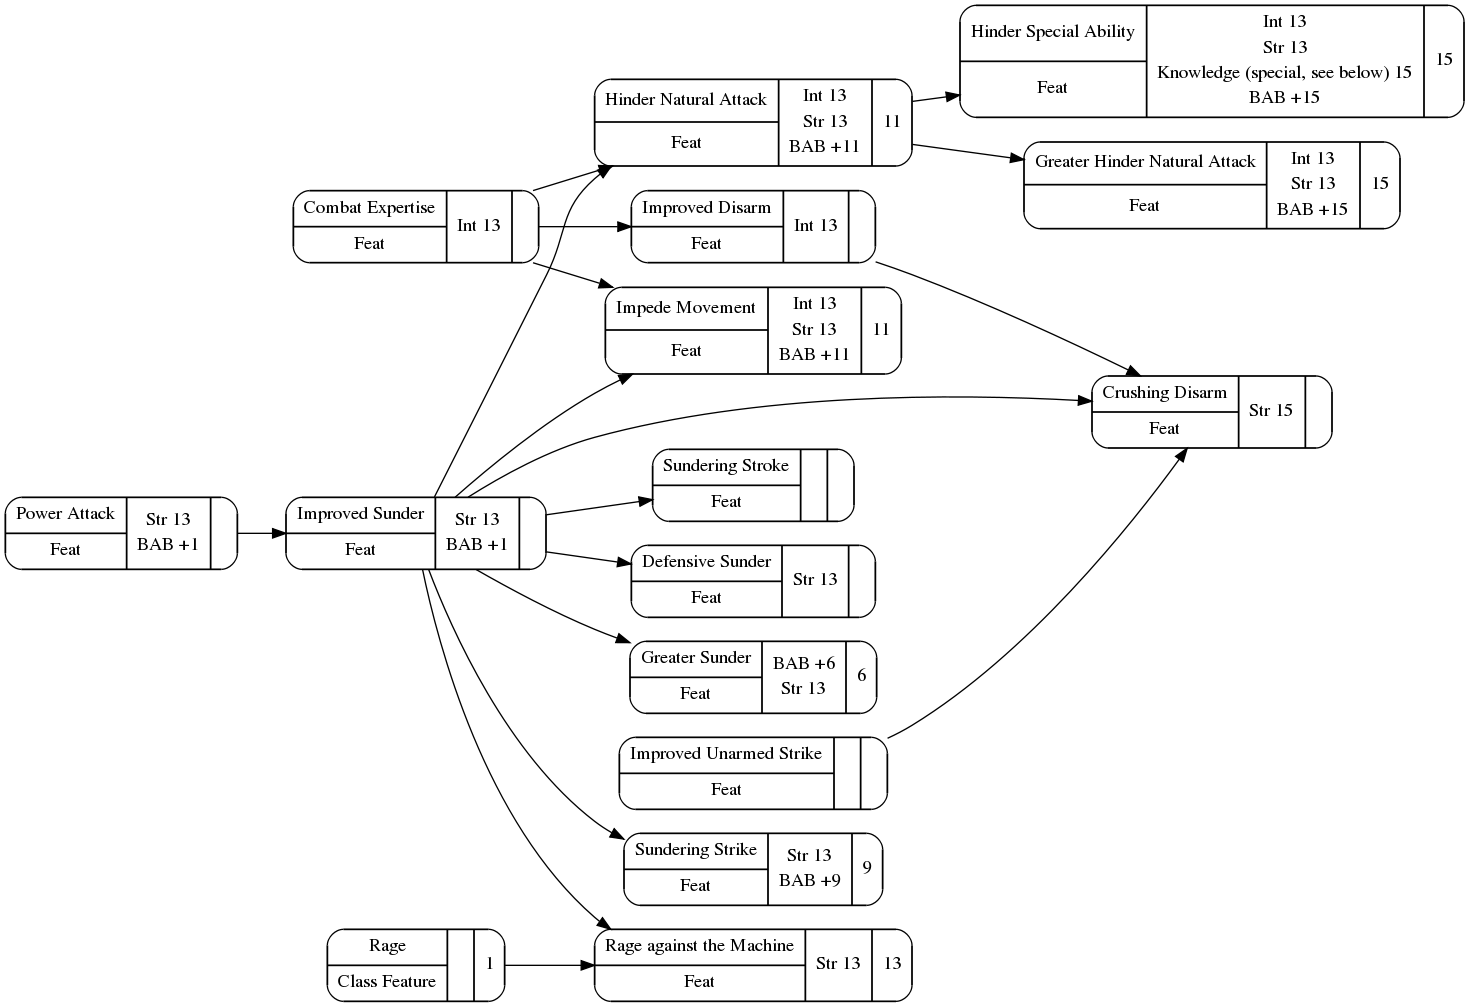
1 2 3 4 5 6 7 8 9 10 11 12 13 14 15 16 17 18 19 20 21 22 23 24 25 26 27 28 29 30 31 32 33 34 35 36 37 38 39 40 | digraph "Improved Sunder" { node [style="rounded,filled",shape=record,fillcolor=white]; concentrate=true; rankdir=LR; "feat.crushing-disarm" [label="{{Crushing Disarm|Feat}|Str 15|}"]; "feat.improved-disarm" [label="{{Improved Disarm|Feat}|Int 13|}"]; "feat.combat-expertise" [label="{{Combat Expertise|Feat}|Int 13|}"]; "feat.improved-sunder" [label="{{Improved Sunder|Feat}|Str 13\nBAB +1|}"]; "feat.power-attack" [label="{{Power Attack|Feat}|Str 13\nBAB +1|}"]; "feat.improved-unarmed-strike" [label="{{Improved Unarmed Strike|Feat}||}"]; "feat.defensive-sunder" [label="{{Defensive Sunder|Feat}|Str 13|}"]; "feat.greater-hinder-natural-attack" [label="{{Greater Hinder Natural Attack|Feat}|Int 13\nStr 13\nBAB +15|15}"]; "feat.hinder-natural-attack" [label="{{Hinder Natural Attack|Feat}|Int 13\nStr 13\nBAB +11|11}"]; "feat.greater-sunder" [label="{{Greater Sunder|Feat}|BAB +6\nStr 13|6}"]; "feat.hinder-special-ability" [label="{{Hinder Special Ability|Feat}|Int 13\nStr 13\nKnowledge (special, see below) 15\nBAB +15|15}"]; "feat.impede-movement" [label="{{Impede Movement|Feat}|Int 13\nStr 13\nBAB +11|11}"]; "feat.rage-against-the-machine" [label="{{Rage against the Machine|Feat}|Str 13|13}"]; "class-feature.rage" [label="{{Rage|Class Feature}||1}"]; "feat.sundering-strike" [label="{{Sundering Strike|Feat}|Str 13\nBAB +9|9}"]; "feat.sundering-stroke" [label="{{Sundering Stroke|Feat}||}"]; "feat.improved-disarm" -> "feat.crushing-disarm"; "feat.combat-expertise" -> "feat.improved-disarm"; "feat.improved-sunder" -> "feat.crushing-disarm"; "feat.power-attack" -> "feat.improved-sunder"; "feat.improved-unarmed-strike" -> "feat.crushing-disarm"; "feat.improved-sunder" -> "feat.defensive-sunder"; "feat.hinder-natural-attack" -> "feat.greater-hinder-natural-attack"; "feat.combat-expertise" -> "feat.hinder-natural-attack"; "feat.improved-sunder" -> "feat.hinder-natural-attack"; "feat.improved-sunder" -> "feat.greater-sunder"; "feat.hinder-natural-attack" -> "feat.hinder-special-ability"; "feat.combat-expertise" -> "feat.impede-movement"; "feat.improved-sunder" -> "feat.impede-movement"; "class-feature.rage" -> "feat.rage-against-the-machine"; "feat.improved-sunder" -> "feat.rage-against-the-machine"; "feat.improved-sunder" -> "feat.sundering-strike"; "feat.improved-sunder" -> "feat.sundering-stroke"; } |
This file was machine-generated. The ‘digraph’ marker in the first line indicates that this is a directed graph, so edges will default to having an arrow unless I direct it otherwise.
The node direction on the second line defines the default node shape (which will be used unless and until overridden; it isn’t in this diagram). ‘style=”rounded,filled”‘ means the node will have rounded corners and be filled, ‘fillcolor=white’ identifies a while fill color (default is a grey), and ‘shape=record’ indicates that the nodes are to be laid out using a simple table structure.
The ‘concentrate=true;’ on line 3 can allow lines traveling to or from the same node to be bundled together, potentially greatly reducing the clutter in the diagram. As it happens, there are none in this image.
The ‘rankdir=LR;’ on line 4 instructs dot to arrange the hierarchy from left to right.
After that it gets into the actual content. Each node is identified by a unique string (object identifier in my source data). The label attribute identifies the cells and their arrangement in the node. ‘label=”{{Crushing Disarm|Feat}|Str 15|}”‘ creates a horizontal (in this orientation/rankdir) record containing three fields, one of which is a ‘vertical record’ containing two cells, one being the name of the feat and the second the object type (‘Feat’), the next containing a score prerequisite (‘Str 15′), and the last empty. In other nodes I put any level requirement the prerequisite has, such as the level 11 prerequisite on Impede Movement. I use a similar layout for all the nodes included in the diagram. I do use some different node definitions in other diagrams, such as a ’rounded octagon’ for ‘or nodes’ (prerequisites where only one of two or more conditions must be met).
Finally, I identify all the edges I want to represent in this graph. Each edge is identified using the unique identifiers of the nodes on either end. For instance, on line 23 you can see ‘”feat.improved-disarm” -> “feat.crushing-disarm”;’, indicating that Improved Disarm is a prerequisite of Crushing Disarm.
Note that at no time do I provide any direction to layout except identifying the relationships. This is incredible useful because I can focus on discovering and identifying the relationships, not on arranging the nodes. The layout engine will do that for me.
Again, run this through dot and I get a pretty picture that explains a lot that would be really quite difficult to see based on the text of the feats… spread across several books and PDFs.
neato
neato is another program for laying out graphs, but it is non-hierarchical. This is very useful when there are undirected relationships, as with the areas of The Keys of Heraka-at.
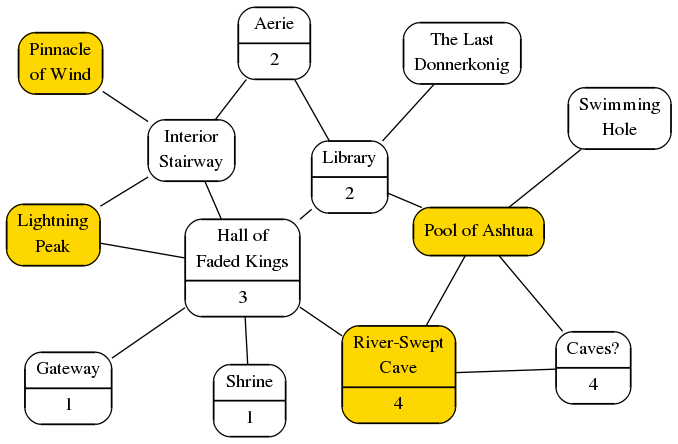
The source code is pretty straightforward.
1 2 3 4 5 6 7 8 9 10 11 12 13 14 15 16 17 18 19 20 21 22 23 24 25 26 27 28 29 30 31 32 33 34 35 | graph { overlap=false; rankdir=LR; node [shape=record,style="rounded,filled",fillcolor=white] A [label="Pinnacle\nof Wind",pos="75,110",fillcolor=gold]; B [label="Shrine|1",pos="133,52"]; C [label="Hall of\nFaded Kings|3",pos="148,100"]; D [label="The Last\nDonnerkonig",pos="274,216"]; E [label="Swimming\nHole",pos="314,7"]; // F [pos="200,200"]; G [label="Gateway|1",pos="114,135"]; H [label="Pool of Ashtua",pos="315,135",fillcolor=gold]; I [label="Interior\nStairway",pos="66,169"]; J [label="Aerie|2",pos="5,237"]; L [label="Lightning\nPeak",pos="144,197",fillcolor=gold]; M [label="Caves?|4",pos="292,52"]; N [label="River-Swept\nCave|4",pos="245,22",fillcolor=gold]; O [label="Library|2",pos="241,139"]; B -- C; J -- O; E -- H; C -- G; H -- M; C -- O; C -- L; I -- C; I -- J; I -- L; H -- N; M -- N; C -- N; O -- H; A -- I; D -- O; } |
I had originally had a node ‘F’, but I ended up abandoning it and simply commented it out. The base graph was created by a program GreyKnight wrote and includes a ‘pos’ attribute for each node, but I ignore them when I render the graph. I think the rest is pretty straightforward after reading the other diagram explanations, so I’ll just highlight a couple of points that may be of interest.
The ‘rankdir=LR;’ on line 3 actually does not change the arrangement of the nodes at all, but does rearrange the cells of the record inside the node. It causes the number of sub-elements to be displayed on the bottom instead of to the right; this would be much more dramatic in the feat diagrams.
Notice that I define default node attributes on line 4, but override the fillcolor attribute for nodes ‘A’, ‘H’, ‘L’, and ‘N’ (the areas assigned to the Donnerkonig treasures) to highlight them in the diagram.
Closing Comments
Visualization is a powerful tool for understanding potentially complex relationships. Using the right tools — and Graphviz is a very powerful, and free one — can make visualization much easier to enact.
Also, visualization can make it much easier to find errors in data. For instance, if my scripts can’t parse a prerequisite it gets rendered in a different color to highlight it for me. When I find it, I can either improve my scripts to parse such cases, or correct the data error (‘Blindfight’ is not a Pathfinder feat, it is ‘Blind-Fight’), or simply accept that “does not have levels in a class with the Grit class feature” is a weird case and choose to ignore it.
For the Echelon Reference Series I’m actually laying out the diagrams for the books using different tools (also text-based, but I must identify the node positions myself, and to some degree lay out the edges between them) but I want the precise control in order to make the diagrams fit on the page as I want. The machine-generated diagrams are a big help, though. In many cases I need simply recreate the machine-generated layout and tweak it somewhat, others need to be redrawn entirely.
Either way, automation and machine-generated diagrams help me understand and make sense of large amounts of data with inobvious relationships, and consequences of those relationships.
Pingback: Workflows for Extracting Data from Word | Keith Davies — In My Campaign - Keith's thoughts on RPG design and play.
Pingback: Workflows for Extracting Data from Word Files | Keith Davies — In My Campaign - Keith's thoughts on RPG design and play.