
It astonishes me sometimes how long I’ve been working on Echelon, and even just on the Echelon Reference Series (I spent a year working toward the first release in September 2014). The Echelon Reference Series has been a five-year project just gathering information for the game I’m actually working toward.
The mission in Star Trek: TOS was originally only five years. FML
ANYWAY, over time my document workflow has changed a few times. Here’s the latest iteration, for those who wish a look into the mind of someone not quite right (and so I have a copy to remind myself how I’m doing this).
Deep geekery ahead.
Document Transformations
The first step is reasonably straightforward. I have a Word file (specially formatted using styles) that I transform to XML, then run several transformations until I get to an XML data file that is a mix of document and game object information. Under the covers a Word ‘DocX’ file is a ZIP file containing XML files, so this is not as horrible as it sounds.
| File Extension | Content |
|---|---|
| DocX | ZIP file containing document information in XML format. Ignore most of the files, but pull out document.xml, styles.xml, and numbering.xml. The first contains the actual document content, the second contains details of the styles used in the document (which I use later to identify object types and data structures), the last contains details of list types (so I can tell the difference between bullet lists and numbered lists, where I haven’t applied specific styles to the paragraphs). |
| WML-Clean | XML file containing the document after applying details from the style and numbering definitions, and stripping all the extra stuff Word includes that I don’t care about (such as table column widths, spelling- and grammar-check markup, and so on). |
| WML-Group | XML file containing now-hierarchical document. Word treats a document as a series of blocks, with no document hierarchy inherent in the file. That is, it is much like HTML: a Heading 1 paragraph and Heading 2 paragraph look in Word as if one is nested inside the other, but they’re actually siblings (same parent object). This transformation builds the document hierarchy up I have a document section ‘level 1’ with a document section ‘level 2’ inside it. It also builds list hierarchies (so I can have nested lists) and nested hierarchies for game elements (such as class features inside a class). |
| WML-Normal | XML file with the same document structure, but now with game objects correctly identifying the game object type. As part of the grouping, I have ‘declarations’ (d20-#-Decl style) with objects nested within them. As part of normalizing, each object is assigned a type (and sometimes a few other things) from the nearest parent declaration. There is no inherent link between depth (declarations and objects run from levels 1..4) and the content: most often I use ‘d20-3’ for game objects such as spells. If I had a monster with a unique spell, though, the monster might be defined as a ‘d20-3-Object’ containing a ‘d20-4-Object’ for the spell.
In any case, this step removes the intermediate elements used for classifying the information: I can now know enough to explicitly identify the objects, without necessarily knowing anything more about them. (That’s the next step.) |
| Master-<dataset>.WML-Index | These files aggregate game data by dataset (PRD-Only, 3pp+PRD, etc.). All source WML-Normal files that land in this data set are included in the WML-Index file
Because I now know all the objects present, I can build an index I can use to search for things. For instance, if I find text in italics, I can search the lists of spells and magic items to see if there is a match. If I get a unique match (‘fireball’, say, matches just the spell) I can consider this a link. The ‘master’ files are built from the WML-Normal files. All files for a particular data set are loaded, extraneous information discarded so I have only the game objects (with ‘group IDs’ based on object-type.object-name, and full IDs that include parent objects if any). Evasion is a class feature of the monk, ranger, and rogue classes (among others, but we’ll start with this). I have a <d20:object> with ID and group ID ‘class-feature.evasion’, containing child <d20:object> elements with IDs ‘class-feature.evasion!class.monk’, ‘class-feature.evasion!class.ranger’, and ‘class-feature.evasion!class.rogue’. I also have ‘universal-rule.evasion’, ‘ninja-trick.evasion’, and so on, but they are at the same level as ‘class-feature.evasion’. This seeming redundancy is important in the next step. |
| WML-Parse | At this point I have structured the document and the game data pretty well, but I don’t know anything about it. This stage examines the document and object text to learn more about it. Links (explicitly identified by ‘ref styles’ such as ‘ref Feat’) or implicitly by formatting (italics are often an indicator of spell names or magic item names) can be identified and established. The italicized fireball actually looks something like <doc:text format=”italics” refid=”spell.fireball” reftype=”spell”>fireball</doc:text> in XML.
Similarly, prerequisites (previously extracted but not examined) can be resolved. A prerequisite of “Critical Focus” matches only one top-level indexed object (feat.critical-focus), and is easily resolved. Precise Shot, however, cannot (I expect somewhere a class has a ‘precise shot’ feature that… grants the Precise Shot feat). If the prerequisite were ‘Precise Shot feat’ (which resolves to only one object) or was ‘Precise Shot’ with the ‘ref Feat’ style (and I have other means of resolving conflicts) it would work. |
| Master-<dataset>.WML-Master | As Master-*.WML-Index, these files (one per dataset) have all the game objects from the source documents (each aggregates all relevant WML-Parse files). Later process will draw from these files to produce the actual documents. |
| WML-PreTex | These documents contain all content to go into the PDF. The WML-Parse file is loaded and the relevant master dataset file, and all ‘refcopy’ elements pull the associated game objects. A ‘refcopy’ element can be a specific ID (“feat.alertness”) or can be wildcarded (“rogue-talent\..*” pulls all rogue talents). This actually splits on dataset, depending on the WML-Master dataset used. |
| TeX | After the WML-PreTex file is created, it gets transformed to a LaTeX file, which will in turn be transformed to PDF. This is not an XML file. |
| Finally! The TeX file is converted to PDF. Indexes are constructed, references within the document are hyperlinked, and so on. |
There are few other files worth mentioning.
- The WML-* files are not indented, to save a bit of space and processing time. I can generate XML versions that are indented (xmllint -pretty) if I need to spot check something, such as when debugging the transformation scripts, or even just when trying to find where an object is defined.
- LaTeX uses a large number of intermediate files, but since they’re really used in only one set of transformations and should understood by anyone working on the LaTeX transformation, I won’t describe further.
As a minor aside, the extensions are chosen so they are in more or less alphabetical order by workflow. Docx gets cleaned, grouped, normalized, parsed, and prepared-for-TeX. The master files are processed to aggregate Index information, Master information, and Node information. This makes it much easier for me to remember which bits happen when.
Datasets
I mentioned datasets above. The Echelon Reference Series is produced using several distinct data sets. To date I have published ‘3pp+PRD’ PDFs containing information from the PRD and select third-party publisher supplements, and ‘PRD-Only’ PDFs containing only information from the PRD. For my own use I have a ‘PZO’ data subset that contains information from other Paizo supplements that have not made it to the PRD (and that I have not cleansed of Product Identity), which combines with the others to give me a ‘PRD+PZO’ dataset (everything from Paizo) and an ‘All’ dataset that has, as you might guess, all the data.
The documents for the different datasets have the same document source file (ERS-Cleric uses the same source file for 3pp+PRD and PRD-Only), but draws data from different master files (master-pf-3ppprd.wml-master and master-pf-prd.xml-master respectively).
Diagrams
The Echelon Reference Series contains diagrams illustrating the relationships between game objects. As a very small example, a tiny subset of the reality, the Weapon Focus feat gives access to Weapon Specialization and Greater Weapon Focus, and those latter two feats together provide access to Greater Weapon Specialization.
The relationships are discovered programmatically by taking the parsed data (the WML-Master file specifically) and following the prerequisites to identify the diagram elements. This part is spiritually unchanged (exact details of parsing and whatnot are different, but the algorithm’s the same). Once the elements of each diagram are found, scripts generate DOT files (used by the Graphviz ‘dot’ program to draw hierarchical diagrams) and create PNG files, so I can see what the relationships are.
These PNG files don’t look bad when I use them as they are, but including them in the PDFs invariably looks really bad. Scaling the files does bad, bad things, so I end up redrawing them using the PGF/TikZ library.
The process of going from ‘data and machine-generated diagrams’ to ‘good-looking diagrams’ is changing quite a bit.
Old Diagram Creation
Until today, each diagram was stored in a single file where the LaTeX process could find it. When called on to do so, LaTeX loads and inserts the file. This part isn’t that bad, really…
But! Each diagram file was laid out by hand. The automated process could give me a skeleton template with the nodes and edges, but this is only a start. Some nodes will need adjustment (a feat with ‘evasion class feature or evasion ninja trick’ as a prerequisite would have two nodes called ‘evasion’; at least one must be changed), and all nodes need to be explicitly placed (‘A is here, B is to the right of A, C is above B this far, …’). This is exceedingly tedious and time-consuming.
It works, but it sucks.
New Diagram Creation
Last night I finally looked into TikZ ‘matrix layout’. Each diagram is treated as a two-dimensional array of nodes. In the LaTeX source file, I basically lay out a table and put nodes where they are in relation to each other, then identify the edges and let it go. This opens the door to a huge simplification of my life.
- Each diagram can now be represented as a table in Word. This gives me a place to hang diagram metadata (caption and ID and sundry other bits), a place to arrange the nodes in a matrix (the table body), and a place to identify the edges (a table nested in the footer of the parent table — I can have only one footer record, so I have to nest a table).
- Each node is represented in this table using the ID of the object the node represents. If I need information about the object (name and type for the label, object type for indexing, and so on) I can simply retrieve it from the data object definition. Even better, this is information all available in the WML-Index file. I can replace the ID strings representing the nodes with all the information I need for the node, and if I have nodes for two objects with the same name (such as evasion, above) they are already differentiated by the ID. I can even identify common node characteristics in the Taxonomy file, leveraging that as well.
- Each edge can identify its source and destination nodes, and I can include attributes to override the default setting (most often edge exit and entry points — default is ‘out=0,in=180’, or out the center of the right side and in the center of the left side of each node) and ‘edge nodes’ for annotations on the edge itself (such as ‘3 ranks’ or ‘level 4’ for skill and class prerequisites, when shown in the diagram).
- Also in the footer, I can have a list of object IDs to ignore (more on this later).
The node identities and edge list can both be generated programmatically. I could do so before, but they were basically just lists of strings. Now for each input Word file, I can create an HTML file (for simplicity) containing a bunch of tables, each of which has metadata in the header records, a body containing a top row with a number of cells equal to the width of the diagram (number of steps from ‘first node’ to ‘last node’ plus one), each containing all the IDs of the nodes to include in that column, and even a number of rows equal to the largest number of IDs in any of the columns of the first row (so I’ve got a place to cut and paste them). The footer (last record) can be a single cell spanning the table and containing a nested table of the edges (source, destination, attributes, edge node), and probably a list containing all the IDs eligible for inclusion in the diagram (which can be used in update detection, below).
My part of the laying out now consists of copying this table from my browser to Word, then moving the IDs to the cells that will hold the nodes. If I find an ID that is not needed (I often ignore class nodes) I can append it to the ignore list.
When this gets parsed (WML-Parse step) the table will be picked up as a ‘diagram table’ and output as a <doc:diagram> element that is structurally as the table above. The information needed for each node can be retrieved from the WML-Index file and the node specified fully. When I need the diagram later, I can explicitly include it via refcopy (refcopy just looks for an element and copies it to the current location).
Because these diagram files are generated as part of WML-Parse, they will be available for inclusion in the WML-Master files for each data set. Not only will they be easier to create, they will be easier to discover and update.
Update Detection
Because each diagram file will be included in the dataset WML-Master file, when I create the HTML file for the diagrams of a specific Word file I can now have a script examine the list of IDs for a specific diagram and the list of IDs being added to the HTML table. If I find I’ve got IDs in the HTML table that are not in the ID list of the diagram, I can flag the HTML table for review. If all IDs are present, I might assume the diagram is current, complete, and correct, and grey the table out. If the diagram is not found at all, the table is presented in black. If the diagram is present and does not contain all the IDs, I might color the table blue (or red, but red is obnoxious — I might save that for the specific IDs that are not present, though). I should be able to skim the HTML file for a source document and quickly identify which diagrams need updating, and the nodes that need to be added.
Workflow Diagrams
Strangely enough, considering this whole post was prompted by changes to the workflow to support creating and maintaining diagrams, I… have diagrams to describe the workflow.
Yesterday’s Workflow
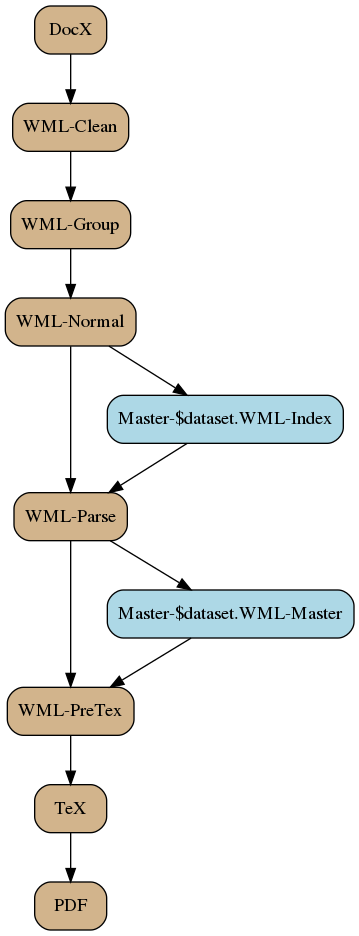
The workflow is pretty simple. Each source document is
- transformed until each game object is identified;
- aggregated into the appropriate dataset indexes;
- parsed (using the most complete dataset index) to resolve links and prerequisites;
- aggregated into the appropriate dataset master files;
- merged with dataset master files for each output file;
- converted to LaTeX source file;
- converted to PDF.
This is slightly inaccurate, in that not all files that get processed and output as PDF. Only a very small subset will actually get published, after all.
That said, I do find it useful for myself to generate a PDF for each input Word file, especially on initial capture, because I can use this to verify that I’ve correctly and adequately marked things up. If I forget the declaration in front of an archetype, the object is not presented on a new page (default behavior is to not break before new objects) and with black text on dark brown (default colors — they stand out as unreadable, and easy to find). Inadequate markup on references and prerequisites won’t get picked up, so now is a good time to fix those, too.
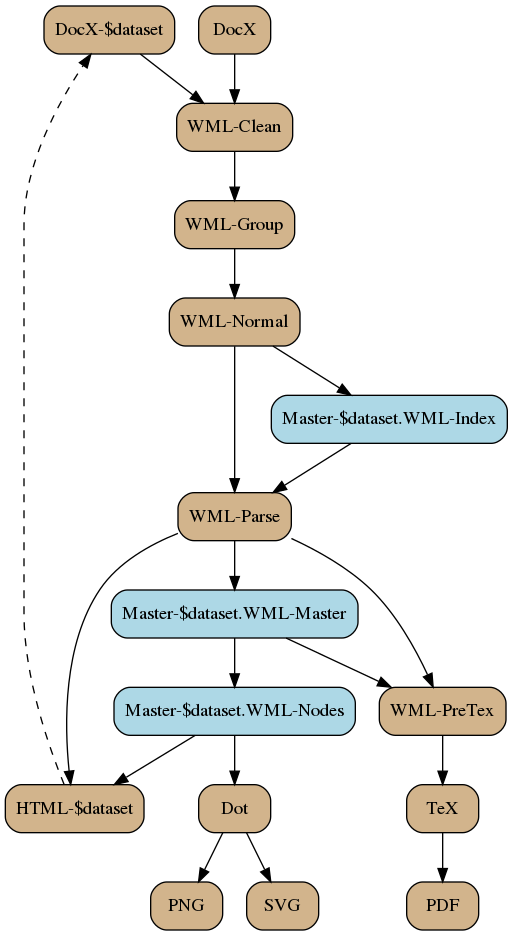
New Workflow
Much of the new workflow is more or less the same, so I’ll just describe the differences (additions, for the most part).
A new directory structure has been build in parallel with the original one. Where the original one had ‘pf/’ as its root inside the ‘docx/’ directory, there will now be a ‘pf-$dataset/’ directory (‘pf-3ppprd’, ‘pf-prd’, etc.) containing Word files in the same directory structure as the original. Each source document in ‘docx/pf/’ can have a source document for each dataset, should I choose to do so. Of course, the ‘PRD dataset’ would not include Word files for the 3pp directory (the PRD dataset has no 3pp content, after all, so does not need diagrams for the game objects in those files). This gives me the option of having different diagrams for different datasets — the diagram for Weapon Focus containing only PRD information will be much smaller than the diagram for Weapon Focus containing 3pp and PRD information. I might not use this facility initially, but it will be there.
The dataset-specific diagram files are still processed much the same way (cleaned, grouped, normalized, and parsed), but there are differences. Each dataset-specific diagram file is
- transformed until each game object is identified;
aggregatednot aggregated into dataset indexes;- parsed (using the most complete dataset index) to
resolve links and prerequisitesbuild nodes; - aggregated into the appropriate dataset master files;
- merged with dataset master files for each output file;
- converted to LaTeX source file;
- converted to PDF.
As with other source files, the dataset-specific diagram files are not going to be published but PDFs will still be useful for me to verify layout.
The diagramming component is also new.
Diagramming Workflow Elements
The master file for each dataset will be processed for diagram information. The game objects are
- parsed for prerequisites and the prerequisite tree (thicket…) created for each object that has prerequisites and/or is a prerequisite of one or more other objects;
- output to a dataset node file containing all such diagrams;
- output to a DOT file (one for each node in the dataset, in the directory diagram/$dataset/dot/$object-type/$object-name.dot);
- converted to PNG (DOT file run through Graphviz ‘dot’ program, output to diagram/$dataset/png/$object-type/$object-name.png);
- converted to SVG (DOT file run through Graphviz ‘dot’ program, output to diagram/$dataset/svg/$object-type/$object-name.svg).
Each dataset will result in its own repository of diagrams, grouped by object type. These are not broken down by source document, they are a reference for when I create the ‘nice diagrams’, and sometimes a convenient reference when I’m curious about something. These diagrams do not get published.
I sometimes create both PNG and SVG files because PNG files are usually more conveniently browsed, but SVG files have a couple of uses. First, they scale much more cleanly. It doesn’t happen here (even with Improved Unarmed Strike), but at work I’ve got data flow diagrams so large that they can’t be rendered cleaning as PNG files and the text gets mangled. Second, SVG files are text files, and when you open them you can search the labels to find the node you’re working for — an incredibly handy feature.
Each source data file (I don’t mean the dataset-specific diagram files) can also be joined up to the WML-Nodes files to find the diagrams that should be present for that source file, for each relevant data set, and output an HTML file of tables containing the diagram template, as described above. These can then be used to manually (hence the dashed line) create and/or update the dataset-specific diagram files.
Closing Comments
I didn’t realize this was going to be so long.
(That’s what she said!)
Believe it or not, this is actually simpler than previous iterations of my workflow. It is more powerful and offers me capabilities I did not even have before, but I felt it important to capture… as much as I write game stuff, I can be pretty neglectful of ‘actual documentation’.
I’m working on it.
Thank you for writing this.
You’re welcome, Jay. I actually wrote it with you in mind, you’re one of the people I felt would best be able to appreciate it.
And I have to laugh, because it’s already outdated! Instead of going from ‘nodes’ to ‘HTML’, I’m going from ‘nodes’ to ‘pics’ (which has the DOT files as sort of a side effect, and the ‘pics’ file contains the object IDs and names of the DOT files. A Perl script then uses the pics file as a control script and has dot process each of the files to a ‘plain’ file containing a textual description of the nodes and edges (and most importantly, their locations), which it then wraps up as tables in XML (I’ll explain that later) and embeds in a ‘document.xml’ that gets zipped back into a target DocX file.
Or it will after I add that last bit tonight.
And here’s the updated workflow.